

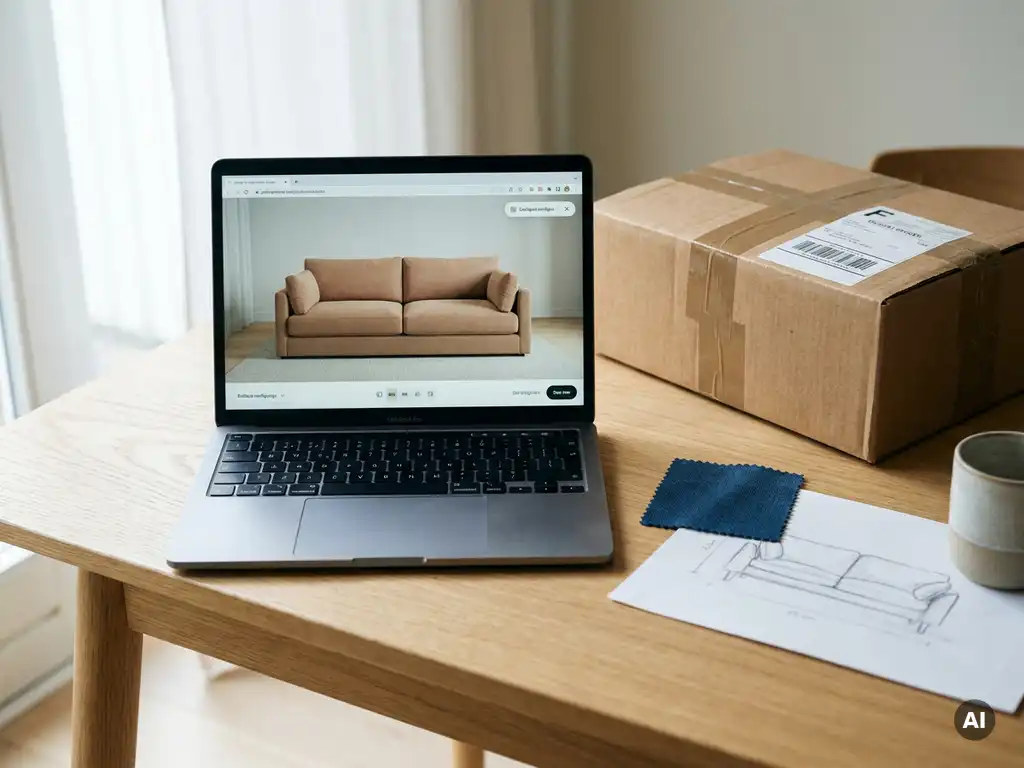
The most effective way to reduce return rates in furniture and home décor is to close the gap between customer expectation and product reality before the purchase happens. When shoppers can see exactly what they are buying – in the right colour, size, material, and context – they make more confident decisions and are far less likely to return what arrives. This article unpacks the key causes of high return rates and the practical strategies that help furniture brands and retailers bring those numbers down.
What causes high return rates in furniture and home décor?
High return rates in furniture and home décor are primarily caused by a mismatch between what customers expect and what they actually receive. The most common triggers are inaccurate colour representation, unexpected dimensions, poor material quality perception, and products that simply do not fit the space or style the customer had in mind.
Unlike fashion or electronics, furniture purchases involve a high degree of spatial and aesthetic judgement. A sofa that looks perfect in a studio photograph may feel completely wrong in a living room with different lighting, flooring, or existing furniture. When customers cannot evaluate a product in their own context, the risk of disappointment rises sharply.
- Colour and material discrepancies: Static product photos, especially those shot under studio lighting, rarely represent how a fabric or finish looks in natural daylight.
- Size and fit issues: Without the ability to visualise scale in a real space, customers frequently misjudge whether a piece will fit physically or visually.
- Limited variant representation: When only one or two configurations are shown, customers ordering other variants are essentially buying blind.
- Impulse purchases without enough information: Streamlined checkout flows can accelerate a purchase before the customer has fully thought through their decision.
Each of these causes points to the same underlying problem: insufficient product information at the moment of purchase. Addressing returns means addressing the quality and completeness of the buying experience itself.
How does poor product visualisation lead to more returns?
Poor product visualisation leads to more returns because it forces customers to fill in the gaps with assumptions – and those assumptions are often wrong. When a product page shows only one or two static images in a single configuration, shoppers cannot accurately judge colour accuracy, material texture, scale, or how the product will look alongside their existing furniture.
This uncertainty does not always stop a purchase. Many customers proceed anyway, particularly when return policies are generous. But the consequence is a higher post-delivery disappointment rate. The product arrives and reality does not match the mental image the customer had built from limited visuals.
For furniture and home décor specifically, this problem is compounded by the sheer number of configurable variants. A dining table available in four sizes, six finishes, and three leg styles represents dozens of combinations. If only the most popular configuration is photographed, every other variant is effectively sold without proper visual representation. Customers ordering a less common variant are taking a leap of faith – and returns follow.
Strong, complete product visualisation removes the guesswork. When customers can see every configuration they might order, rendered accurately and in context, their purchase decision is grounded in reality rather than optimism.
What role does a 3D product configurator play in reducing returns?
A 3D product configurator reduces returns by letting customers build and visualise their exact product before ordering. Instead of selecting options from a dropdown and hoping the result matches their expectations, customers interact with a real-time 3D model that updates instantly as they change materials, dimensions, colours, or components. What they see is precisely what they will receive.
This has a direct impact on return rates for several reasons. First, it eliminates the most common source of post-purchase disappointment: colour and material surprises. When a customer selects a fabric and sees it rendered accurately on a 3D model, they are making an informed choice rather than an educated guess.
Second, a configurator naturally slows down the decision-making process in a productive way. Customers spend more time engaging with the product, considering their options, and arriving at a configuration they are genuinely satisfied with. This deliberate engagement significantly reduces impulsive or uncertain purchases that are likely to result in returns.
Third, for manufacturers and retailers dealing with complex, customisable products, a 3D configurator ensures that the configuration a customer builds is technically valid. Built-in business rules prevent incompatible combinations from being ordered, which reduces errors on both the customer and the production side.
Can augmented reality help customers make better purchase decisions?
Yes, augmented reality (AR) helps customers make significantly better purchase decisions by allowing them to place a virtual version of a product into their own physical space using a smartphone or tablet. For furniture and home décor, this is one of the most powerful tools available for reducing purchase uncertainty and, by extension, lowering product returns.
The core value of AR is contextual confidence. A customer can point their device at their living room and see how a specific sofa – in the exact fabric and colour they have configured – looks against their walls, flooring, and existing furniture. They can check whether it fits the space dimensionally and whether it complements the room aesthetically. This is a fundamentally different experience from viewing a product in isolation on a white background.
AR is particularly effective for customers who struggle to visualise scale. Misjudging the size of a piece of furniture is one of the most frequent reasons for returns, and AR addresses this directly by anchoring the product to a real-world environment with accurate proportions.
When AR is integrated into the same platform as the product configurator – so customers can view their exact configured product in their own space – the impact on decision confidence is even greater. The customer is not viewing a generic model; they are previewing their specific order.
What other strategies help lower return rates in home furnishings?
Beyond visualisation technology, several complementary strategies help furniture brands and retailers reduce return rates. The most effective approaches focus on improving information quality, setting accurate expectations, and supporting customers through the decision-making process.
- Detailed and accurate product descriptions: Dimensions, weight, material specifications, and care instructions should be comprehensive and easy to find. Ambiguity in product copy leads to mismatched expectations.
- Room planning tools: Giving customers the ability to arrange multiple pieces together in a virtual floor plan helps them evaluate combinations and spatial fit before committing. Our room planning software is built specifically for this purpose, allowing customers to configure and visualise entire rooms in 3D.
- Accurate delivery and lead time communication: Customers who receive unexpected delays are more likely to cancel or return orders. Clear, real-time lead time information at the point of purchase reduces this risk.
- Post-purchase support: Providing assembly guides, care instructions, and easy access to customer service reduces the likelihood that a minor issue escalates into a return.
- Consistent presentation across channels: When a product looks different on the brand website versus a retail partner’s site, customers lose trust. Consistent, high-quality visuals across all sales channels set a reliable standard.
None of these strategies replaces the impact of strong visual tools, but together they create a buying experience that is thorough, transparent, and confidence-building from first click to delivery.
How do you measure the impact of visualisation tools on return rates?
You measure the impact of visualisation tools on return rates by comparing return data before and after implementation, segmented by product category and sales channel. The most direct metric is the return rate itself – the percentage of orders returned – tracked over time and compared between products with full visual coverage and those without.
A clean measurement approach requires a few key steps. First, establish a baseline return rate before any new visualisation tools go live. Segment this by product type, configuration complexity, and sales channel so you can identify where returns are most concentrated. After implementation, track the same segments and look for statistically meaningful shifts.
Several supporting metrics add depth to the analysis:
- Return reason codes: If your returns process captures why customers are returning products, you can track whether “not as expected” or “wrong colour/size” reasons decline after better visuals are introduced.
- Conversion rate and average order value: Visualisation tools typically improve both metrics alongside reducing returns, giving a fuller picture of commercial impact.
- Time spent on product pages: Customers who engage with configurators or AR features tend to spend more time on product pages, which correlates with more considered purchases and fewer returns.
- Customer satisfaction scores: Post-delivery surveys that ask whether the product matched expectations are a direct proxy for the quality of the pre-purchase experience.
The most meaningful evidence comes from comparing like-for-like products – the same item, sold with and without enhanced visualisation – rather than drawing conclusions from overall return rate trends, which can be influenced by many unrelated factors.
How iONE360 helps reduce return rates
We built iONE360 specifically to solve the visualisation challenges that drive returns in the furniture and home furnishings industry. Our platform brings together every tool a manufacturer or retailer needs to give customers complete confidence before they buy.
- Interactive 3D product configurator: Customers build their exact product in real time, selecting materials, dimensions, and components while seeing accurate 3D renders update instantly – eliminating colour, material, and configuration surprises.
- Augmented reality: Shoppers place their configured product in their own space using any smartphone or tablet, checking fit and style in their actual environment before committing.
- Automated packshot generation: Every product variant is represented with high-quality, photorealistic imagery – no more customers ordering blind from configurations that were never photographed.
- Integrated room planner: Customers can arrange and configure multiple pieces together in a 3D room, removing spatial uncertainty and reducing the chance of ordering something that does not work in context.
- Seamless integration: iONE360 connects with existing PIM, ERP, and e-commerce systems, ensuring consistent and accurate product data across every sales channel.
The result is fewer returns, higher conversion rates, and customers who are genuinely satisfied with what arrives at their door. Ready to see what iONE360 can do for your return rates? Get in touch with our team and we will show you exactly how it works for your product catalogue.
Frequently Asked Questions
How long does it typically take to see a reduction in return rates after implementing 3D visualisation tools?
Most furniture brands and retailers begin to see measurable shifts in return rates within the first 60 to 90 days after implementing 3D configurators or AR tools, provided there is sufficient order volume to draw statistically meaningful conclusions. The speed of impact depends on how quickly customers adopt the new tools and how comprehensively product variants are covered. Brands that pair a full rollout of visualisation features with updated product descriptions and accurate lead time information tend to see results faster.
Do visualisation tools like AR and 3D configurators work for all types of furniture products, or only certain categories?
3D configurators and AR deliver the greatest return-reduction impact for products with high configurability, large physical dimensions, or strong aesthetic dependency on surrounding context — think sofas, dining sets, wardrobes, and shelving systems. Simpler, lower-cost accessories may see less dramatic results, though accurate imagery still matters. If your catalogue includes a mix of product types, prioritise visualisation investment for the categories where returns are most frequent and the average order value is highest, as that is where you will recover costs fastest.
What if our product catalogue is very large — how do we manage 3D visualisation at scale without it becoming a bottleneck?
This is one of the most common implementation concerns, and the good news is that modern platforms are built to handle it. Tools like iONE360 use automated packshot generation and rules-based configurators that can produce accurate visuals for every variant without requiring individual manual renders for each combination. By connecting the visualisation platform directly to your existing PIM or ERP system, product data and material libraries stay synchronised, meaning new variants or updated finishes are reflected automatically rather than requiring a separate production process each time.
Are there common mistakes brands make when trying to reduce return rates that actually backfire?
One of the most counterproductive approaches is tightening the return policy in response to high return rates. While it may reduce return volume on paper, it damages customer trust, suppresses conversion, and pushes dissatisfied customers towards negative reviews instead of formal returns. Another common mistake is investing in visualisation tools but only applying them to bestsellers, leaving the long tail of the catalogue underrepresented — which is often where the highest return rates are concentrated. The most effective strategy is to address the root cause of returns through better pre-purchase information rather than making it harder for customers to return.
How important is mobile compatibility for AR and 3D visualisation tools in furniture retail?
Mobile compatibility is essential, not optional. A significant and growing proportion of furniture browsing — and increasingly, purchasing — happens on smartphones and tablets. AR in particular is a mobile-first experience, since it relies on a device camera to overlay a product into a real space. If your visualisation tools require a desktop browser or a dedicated app download, you will lose a large share of potential users before they ever engage with the feature. Look for solutions that work directly in the mobile browser with no app required, as this removes friction and maximises adoption.
Can better visualisation tools also help reduce customer service contacts, not just returns?
Yes, and this is often an underappreciated benefit. A significant proportion of pre- and post-purchase customer service contacts in furniture retail relate to questions that strong visualisation could answer directly — ‘Will this fit in my space?’, ‘What does this fabric look like in daylight?’, ‘Can I see this in a different colour?’ When customers can answer these questions themselves through an interactive configurator or AR tool, the volume of inbound enquiries drops noticeably. This reduces the operational burden on your customer service team and frees them to focus on more complex issues, compounding the overall commercial benefit.
How do we get internal buy-in for investing in 3D visualisation technology when leadership wants to see a clear ROI case?
The strongest ROI case combines three financial levers: reduced return processing costs (logistics, restocking, and write-offs), increased conversion rates, and higher average order values — all of which are consistently associated with better visualisation. Start by calculating your current cost per return, including reverse logistics and any product depreciation, then model the impact of even a modest reduction in return rate across your annual order volume. Pairing this with industry benchmarks and, where possible, a phased pilot on a specific product category gives leadership a low-risk way to validate the numbers before committing to a full rollout.